RUSSIAN JOURNAL OF EARTH SCIENCES, VOL. 20, ES5006, doi:10.2205/2020ES000705, 2020
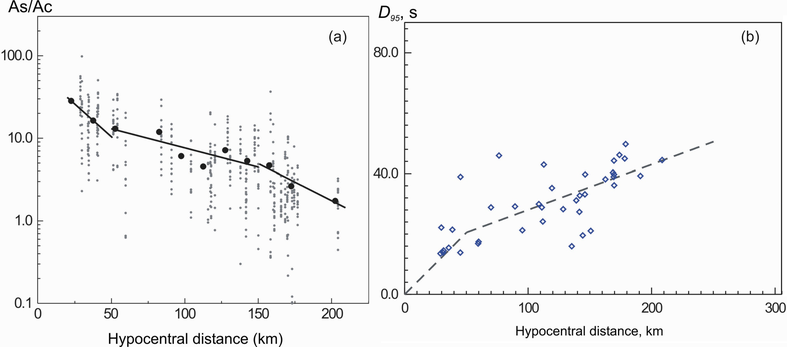
Figure 3. a – Ratios of spectral amplitudes of $S$-waves and coda-waves depending on the hypocentral distance: grey dots – the mixture of data at different frequency bands, black dots indicate the averages within 15-km intervals, and black line is the approximating three-segment function; b – The duration of seismic motions estimated from the records (rhombs) with regard to the hypocentral distance and the duration function used in the simulations (dashed line).

![]()
Citation: Pavlenko Olga V. (2020), Regional characteristics of radiation and propagation of seismic waves in the North-Eastern Caucasus, Russ. J. Earth Sci., 20, ES5006, doi:10.2205/2020ES000705.
Copyright 2020 by the Geophysical Center RAS.
Generated from LaTeX source by ELXfinal, v.2.0 software package.