RUSSIAN JOURNAL OF EARTH SCIENCES, VOL. 20, ES3005, doi:10.2205/2020ES000700, 2020
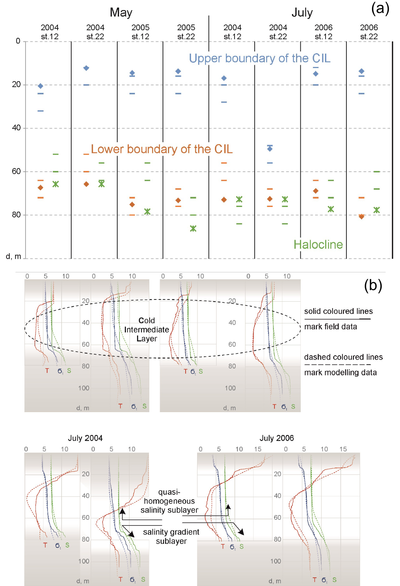
Figure 3. (a) Location of the CIL boundaries and the maximum of salinity gradient in May and July 2004–2006 at stations 12, 22 and the nearest point from the reanalysis. (b) The CIL features on profiles in the Gdask Basin in May and July 2004–2006. Station 12 with the depth of about 80 m, station 22–110 m. The profiles shown by the solid line correspond to momentary field measurements obtained in the Gdask Basin of the Baltic Sea. The dashed lines show mean daily profiles obtained in the model grid points closest to the coordinates of the station of the field measurements. The temperature profile is shown in red, green shows the salinity and blue indicates density.

![]()
Citation: Stepanova N., A. Mizyuk (2020), Tracking the formation of the gradient part of the southeastern Baltic Sea cold intermediate layer, Russ. J. Earth Sci., 20, ES3005, doi:10.2205/2020ES000700.
Copyright 2020 by the Geophysical Center RAS.
Generated from LaTeX source by ELXfinal, v.2.0 software package.