RUSSIAN JOURNAL OF EARTH SCIENCES, VOL. 20, ES2003, doi:10.2205/2020ES000698, 2020
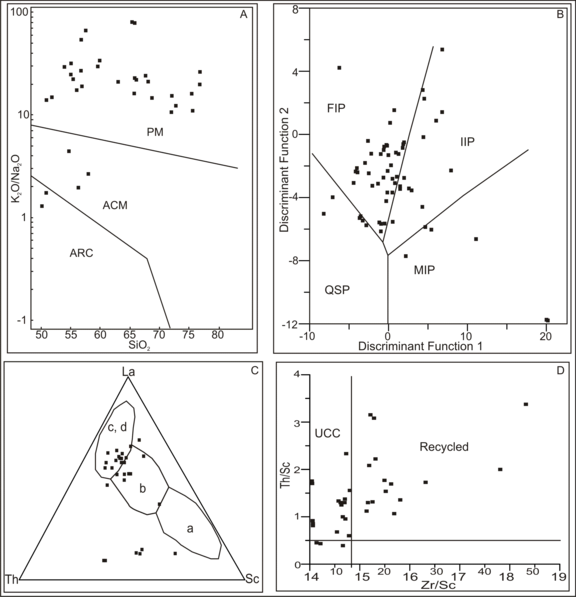
Figure 7. A) Tectonic discrimination diagram for Gondwana sandstones, boundaries after Roser and Korsch [1986], PM = Passive Continental Margin, ACM = Active Continental Margin, ARC=Oceanic Island Arc Margin, B) After Roser and Korsch [1988], F1 = (–1.773 TiO$_2$ + 0.607 Al$_2$O$_3$ + 0.76 (Fe$_2$O$_3$) – 1.5 MgO + 0.616 CaO + 0.509 Na$_2$O – 1.224 K$_2$O – 9.09) and F2 = (0.445 TiO$_2$ + 0.07 Al$_2$O$_3$ – 0.25 (Fe$_2$O$_3$)t – 1.142 MgO + 0.438 CaO + 1.475 Na$_2$O + 1.426K$_2$O – 6.861), FIP = Felsic Igneous Province, IIP = Intermdeiate Igneous Province, QSP= Quartzose Sedimentary Province, MIP = Mafic Igneous Province, C) La-Th-Sc ternary plot for Gondwana sandstones. Fields are after Bhatia and Crook [1986], a = Oceanic Island Arc, b = Continental Island Arc, c = Active Continental Margin, d = Passive Continental Margin, D) Th/Sc – Zr/Sc variation diagram of Gondwana sandstones indicating their source (after McLennan et al. [1993]), UCC = Upper Continental Crust.

![]()
Citation: Mahanta Bashab N., B. R. Syngai, R. K. Sarmah, T. K. Goswami, Amit Kumar (2020), Geochemical signatures of Lower Gondwana sandstones of eastern Arunachal Himalayas, India: Implications for tectonic setting, provenance and degree of weathering, Russ. J. Earth Sci., 20, ES2003, doi:10.2205/2020ES000698.
Copyright 2020 by the Geophysical Center RAS.
Generated from LaTeX source by ELXfinal, v.2.0 software package.