RUSSIAN JOURNAL OF EARTH SCIENCES, VOL. 20, ES1004, doi:10.2205/2019ES000699, 2020
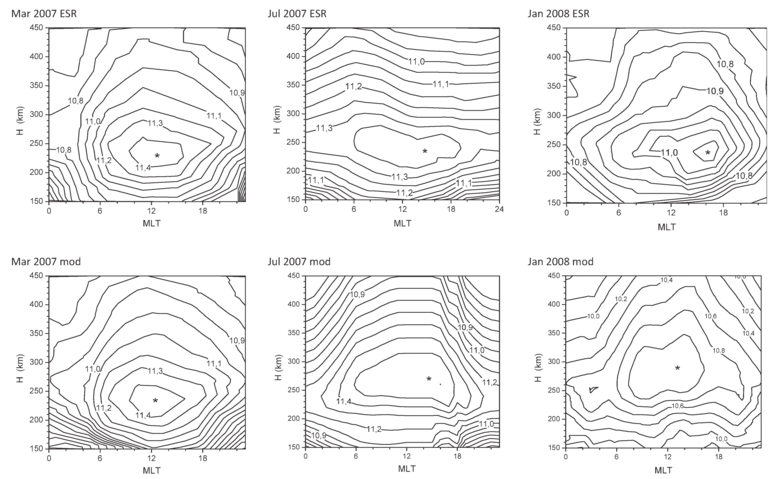
Figure 6. Distributions of $\log(N_e)$ in the frame of MLT-height in the range of 150–350 km for March 2007, July 2007 and January 2008. The actually observed and modeled parameters are presented in the upper and lower row of plots, respectively. In each plot the peak of $\log(N_e)$ is marked by asterisk.

![]()
Citation: Lukianova Renata , Alexander Kozlovsky (2020), Electron density in the polar F region ionosphere during solar minimum: modeling, radar and ionosonde observations, Russ. J. Earth Sci., 20, ES1004, doi:10.2205/2019ES000699.
Copyright 2020 by the Geophysical Center RAS.
Generated from LaTeX source by ELXfinal, v.2.0 software package.