RUSSIAN JOURNAL OF EARTH SCIENCES, VOL. 18, ES4003, doi:10.2205/2018ES000626, 2018
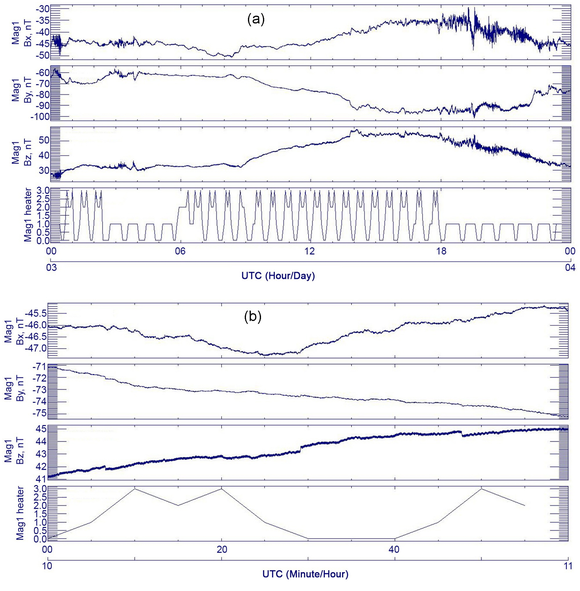
Figure 6. 1-day plot (3 April 2010) (a) and 1-hour plot (1000–1100 UTC, 3 April 2010) (b) plots of 2 Hz magnetograms ($B_x, B_y, B_z$) and heater status. Heater status changes are step-wise as captured in 5-minute housekeeping packets.

![]()
Citation: Soloviev A., Sh. Bogoutdinov, S. Agayan, R. Redmon, T. M. Loto'aniu, H. J. Singer (2018), Automated recognition of jumps in GOES satellite magnetic data, Russ. J. Earth Sci., 18, ES4003, doi:10.2205/2018ES000626.
Copyright 2018 by the Geophysical Center RAS.
Generated from LaTeX source by ELXpaper, v.1.5 software package.